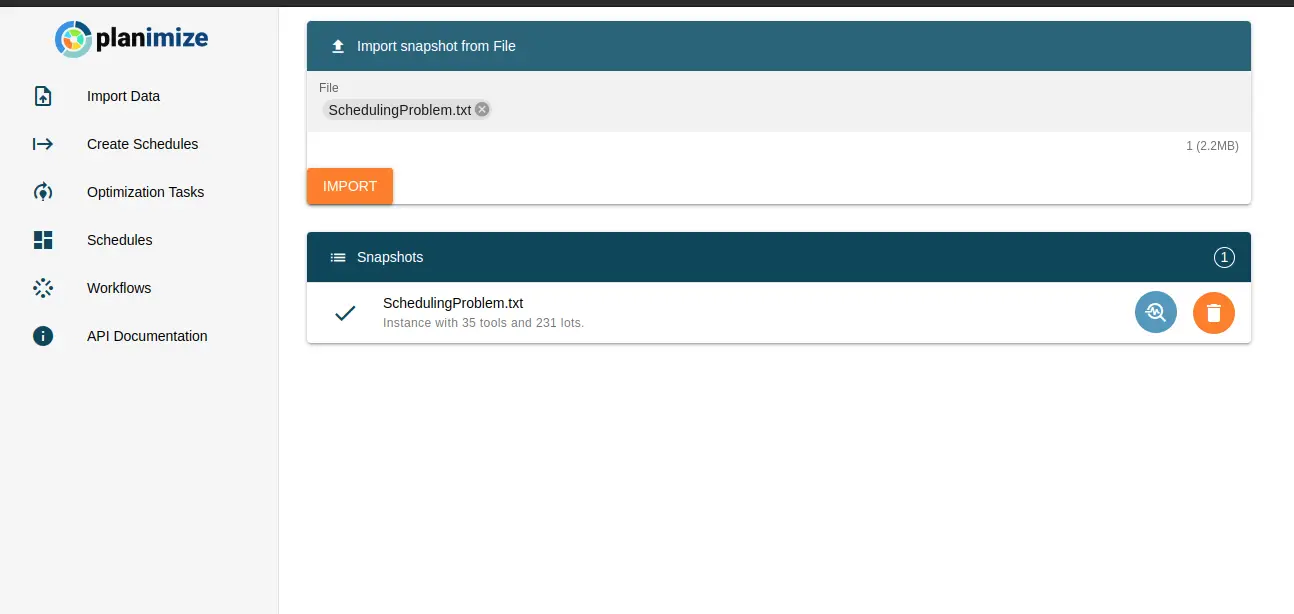
Panelo is the gateway to the optimization engine. This web interface connects your custom production data to the optimization engine, it displays schedules, and computes customized KPIs.
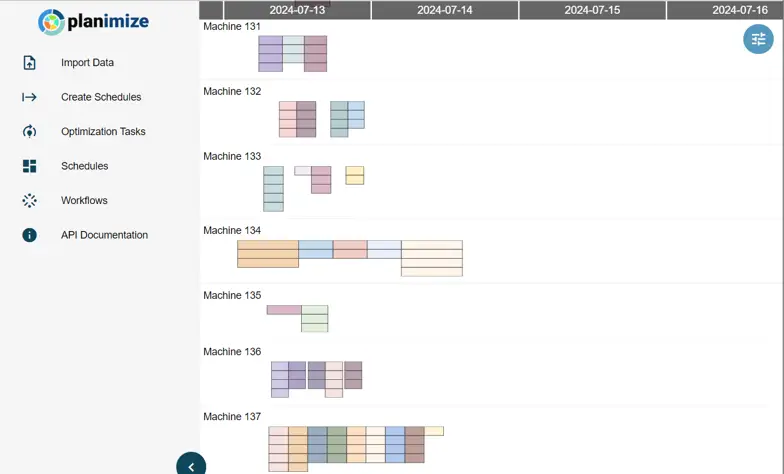
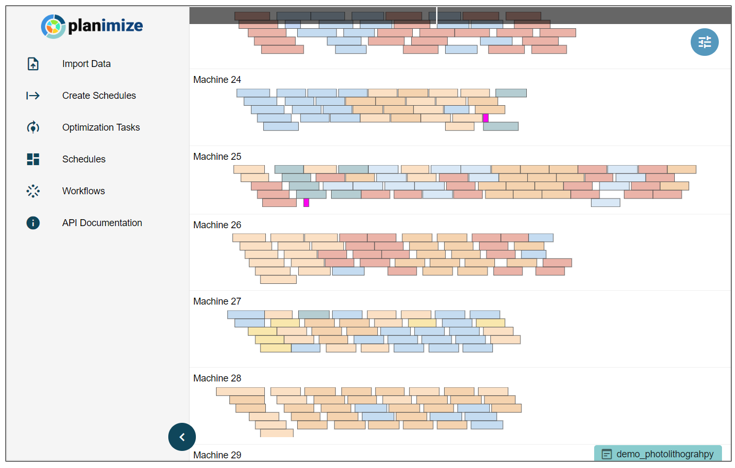
Gantt charts are displayed, enabling solution vizualization, with several coloring schemes (based on products, process types, etc). Intermediate schedules are displayed during the solving process, that can be interrupted anytime.
ViSUALIZE SCHEDULES
Gantt charts are displayed, enabling solution vizualization, with several coloring schemes (based on products, process types, etc).
Intermediate schedules are displayed during the solving process, that can be interrupted anytime.
ANALYZE CUSTOMIZED KPIS
The interface will provide access to as many KPIs as required, defined together with the customer. Further customized monitoring is available on demand.
ANALYZE CUSTOMIZED KPIs
The interface will provide access to as many KPIs as required, defined together with the customer. Further customized monitoring is available on demand.
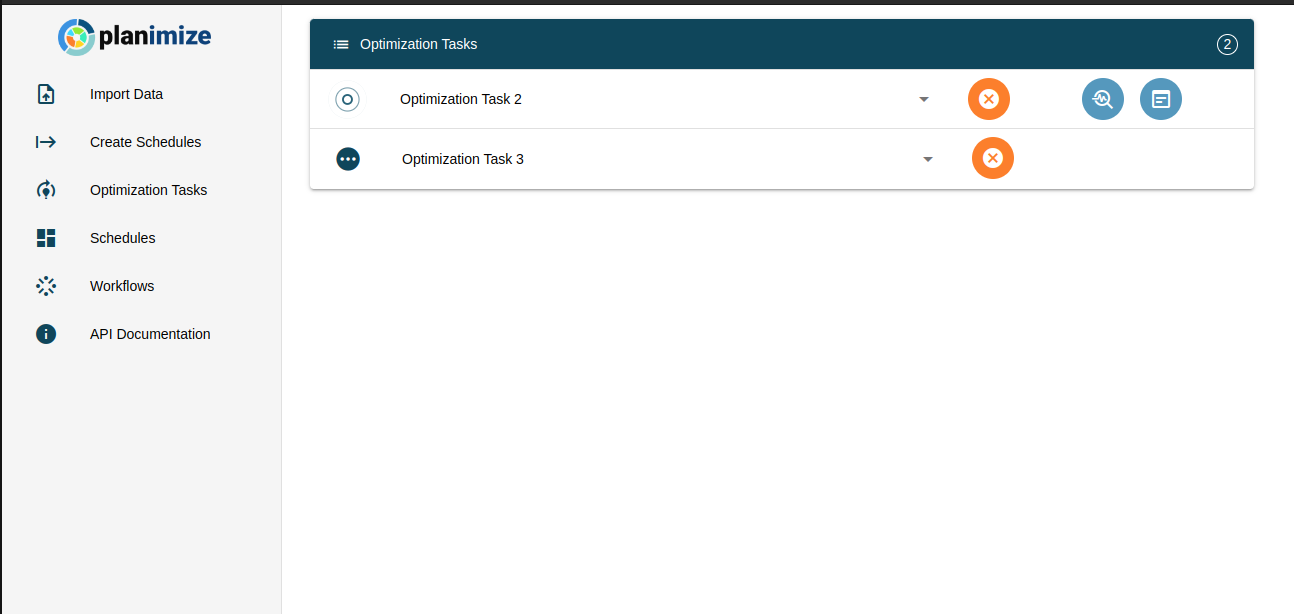
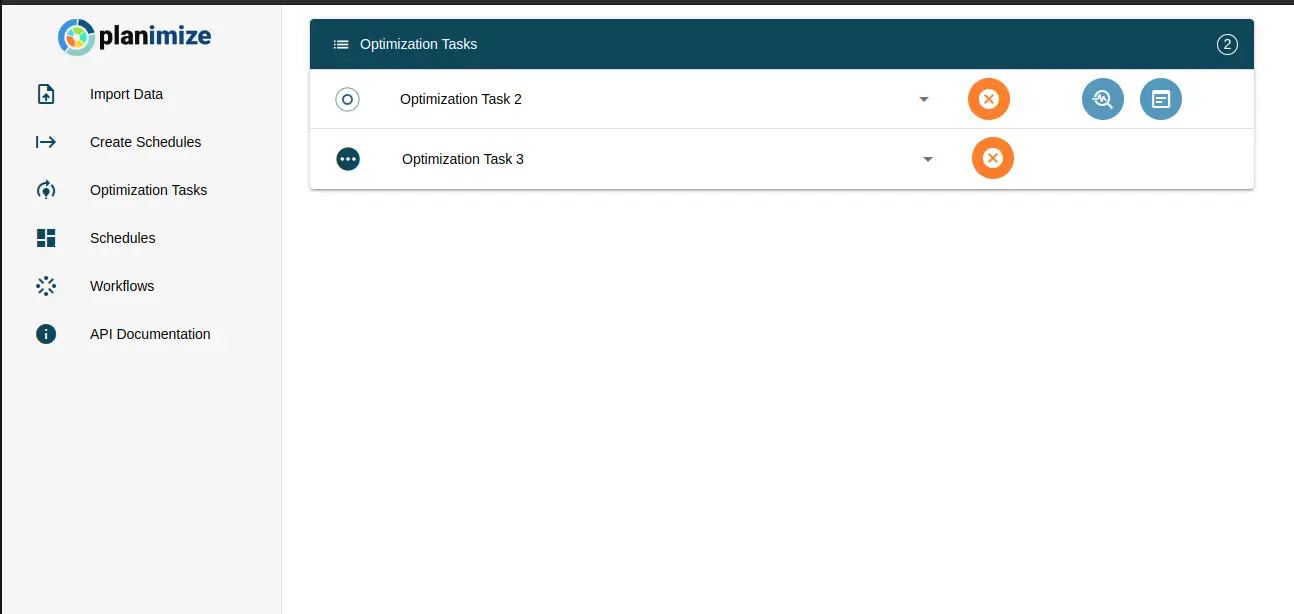
RUN OPTIMIZATION TASKS
Optimization tasks can be run on the interface. Several customized parameters are available, such as the run time and the length of the planning horizon. Intermediate solutions are displayed during the computation, without the need to wait for the run to complete.
RUN OPTIMIZATION TASKS
Optimization tasks can be run from the interface. Several customized parameters are available, such as the run time and the length of the planning horizon. Intermediate solutions are displayed during the computation, without the need to wait for the run to complete.
You want to know more about our solution and expertise?
You can book a demo with Planimize team via the form on our contact page.